The Data Behind the News
The Data Behind the NewsFour cities held 38.7% of Andhra’s municipal electorate—but only 33.8% of votes
An original, reproducible pre-count analysis of November 1 turnout: four cities, the rest of the polled electorate and what the repoll disputes can—and cannot—tell us.
Pan India Pulse desk (AI-assisted research)Updated 2 November 2026, 2:30 pm IST
Four major cities held 38.72% of the electorate in the reported totals for Andhra Pradesh’s November 1 municipal polling, but supplied only 33.78% of the votes. Pan India Pulse calculated the comparison for Visakhapatnam, Vijayawada, Guntur and Nellore. Together, these cities reveal a participation gap that the statewide headline percentage conceals.
The four cities together recorded 1,995,292 votes from 3,751,763 electors: weighted turnout of 53.18%. Subtracting those counts from the reported statewide totals gives 3,910,963 votes among 5,937,298 electors elsewhere, or 65.87%. The difference is 12.69 percentage points. This is an original arithmetic decomposition of the published totals, not a causal estimate of why people voted or stayed away.
The statewide snapshot records 5,906,255 voters among 9,689,061 electors across 92 urban local bodies and 3,453 wards. Dividing voters by electors gives 60.95797%, or 60.96% rounded to two decimals. This report uses that snapshot consistently. Fresh polling and reconciliation may revise the totals; they are not yet certified valid-ballot counts for each office.
Visakhapatnam is the largest component: 919,367 voters among 1,837,901 electors, or 50.02%. Vijayawada recorded 446,021 of 805,797, or 55.35%; Guntur 347,438 of 618,714, or 56.15%; and Nellore 282,466 of 489,351, or 57.72%. Summing their counts before calculating a rate gives the correct weighted comparison. Averaging the four percentages would give each city equal influence despite their very different electorate sizes.
A ranking and a weighted total tell different stories. Chimakurthy recorded 19,298 voters among 22,876 electors, or 84.36%, while Visakhapatnam has a much larger electorate. Ranking both places by percentage measures their participation rates. Adding their voters and electors measures their contribution to the statewide total. A high position in a turnout ranking does not necessarily mean a large effect on the statewide figure, and neither measure identifies support for a party.
The four-city group accounts for 1,756,471 of the 3,782,806 reported electors who did not vote: 46.43%. That is larger than its 38.72% share of registered electors. Visakhapatnam alone contributes 918,534 to that arithmetic difference between registered electors and recorded voters. These are counts in the turnout snapshot, not findings about motivation. Migration, registration quality, access, mobilisation, local competition and other factors could matter; establishing their contribution would require evidence beyond these aggregates.
An illustrative benchmark makes the scale easier to see. If the four-city electorate had voted at the 65.87% rate calculated for the rest of this snapshot, the arithmetic difference would be about 476,035 additional voters. This is a counterfactual comparison, not a forecast, an estimate of suppressed votes or a claim that those voters would have supported any party. The benchmark holds the published elector counts fixed and changes only the participation rate. It says nothing about the distribution of those hypothetical votes between candidates.
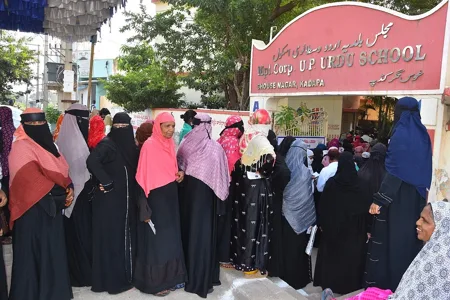
Repolling adds a separate procedural layer. Fresh voting is taking place at identified locations following SEC findings. The aggregate is still disputed: accounts give either 12 stations in six urban bodies or 13 stations in seven, with Tirupati accounting for part of the difference in the named locations. The controlling set of original orders has not been inspected for this report, so that total remains unresolved. A ward, a station and a municipality are different units; combining them would produce a misleading total.
For the same reason, a statewide repoll-incidence rate is not calculated. A defensible rate needs an agreed numerator and the corresponding complete denominator of polling stations, measured at the same stage. Dividing a disputed station count by the number of wards would produce a number with no useful interpretation. Nor does an order at specified locations establish that all voting in a municipality—or the state—was invalid. Wider allegations remain allegations unless supported by their own records and findings.
There is another denominator trap in candidate information. The Pan India Pulse election directory showed 3,628 reported candidate entries across 1,451 of 3,942 recorded seats when inspected on November 2. Its own labels state that official verification is pending. These are coverage metrics for the directory, not a complete SEC census. They cannot establish a statewide average number of candidates per contested seat, a party vote share, an uncontested-win total or a measure of electoral competitiveness.
Counting is scheduled for November 3. No winners, winning margins, party seat shares, invalid-ballot rates or ward-level vote distributions are asserted in this report. Those measures require certified contest-level returns and the correct office-specific ballot totals. The present report is a detailed pre-count account of a checked turnout snapshot, not a completed results report. A later results analysis must retain that distinction rather than retrospectively treating today’s turnout as a prediction.
The three charts show the participation gap, the changing weight of the four-city group and the difference between registered electors and recorded voters. Group totals are summed before division, the remainder is calculated by subtraction, and rounding happens last. This is a pre-count analysis of reported figures. It measures participation and its distribution; it does not establish why people did not vote or predict which candidates will win.
Turnout: four named cities and the rest
November 1, 2026 polling; reported November 2 snapshot · percent
| Label | Value |
|---|---|
| Visakhapatnam | 50.0227 |
| Vijayawada | 55.3515 |
| Guntur | 56.1549 |
| Nellore | 57.7226 |
| Four cities combined | 53.1828 |
| Rest of reported electorate | 65.8711 |
| Reported statewide total | 60.958 |
Method: Votes divided by electors times 100; group totals are summed before division. Rest equals statewide count minus four-city count. Values rounded to four decimals.
Limits: Reported newsroom compilation; original SEC table not inspected. Selected four cities are not all corporations. Repoll reconciliation may revise totals. No inference about vote choice or causes.
Four-city share changes with the denominator
November 1, 2026 polling; reported November 2 snapshot · percent
| Label | Value |
|---|---|
| Share of registered electors | 38.7216 |
| Share of recorded voters | 33.7827 |
| Share of reported nonvoters | 46.433 |
Method: Four-city counts divided by corresponding statewide totals. Nonvoters are electors minus voters in the same snapshot, not a diagnosis of abstention.
Limits: Reported newsroom compilation; original SEC table not inspected. Selected four cities are not all corporations. Repoll reconciliation may revise totals. No inference about vote choice or causes.
Registered electors minus recorded voters in four cities
November 1, 2026 polling; reported November 2 snapshot · people
| Label | Value |
|---|---|
| Visakhapatnam | 918534 |
| Vijayawada | 359776 |
| Guntur | 271276 |
| Nellore | 206885 |
Method: Subtract recorded voters from registered electors city by city. These are differences in published counts, not estimates of suppressed votes.
Limits: Reported newsroom compilation; original SEC table not inspected. Selected four cities are not all corporations. Repoll reconciliation may revise totals. No inference about vote choice or causes.
Political Alignment Lens
Article framing only. This does not establish publisher affiliation, reader beliefs or voting intent.
What the numbers reveal
Analysis by the Pulse deskThe useful finding is concentration: the selected four cities have a disproportionately large share of reported non-participation. That directs a reporting question towards city-level access, registration and mobilisation without answering it prematurely. A statewide percentage alone conceals the contrast between the four-city group and the remainder.
The benchmark also clarifies what the data cannot do. A 12.69-point participation gap does not identify a party’s lost votes, prove manipulation or predict the count. Those claims would need individual contest returns and independent causal evidence. Which city-level records should be published first to help distinguish registration problems from ordinary differences in participation?
What to watch
- Certified November 3 contest-level returns, separated by office.
- Reconciled turnout after fresh polling and scrutiny.
- The original SEC station-specific repoll orders and final station list.
Your take
Do you agree with the Pulse view?